
Understand demand through order data
Sales analytics for Kaspi
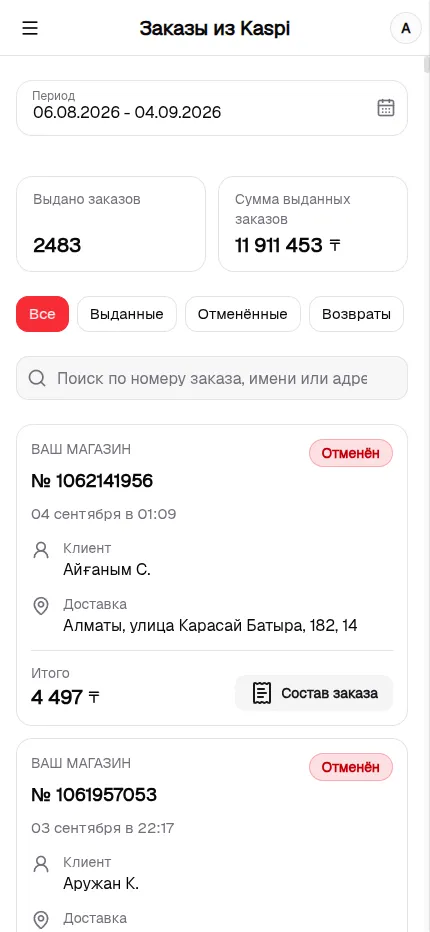
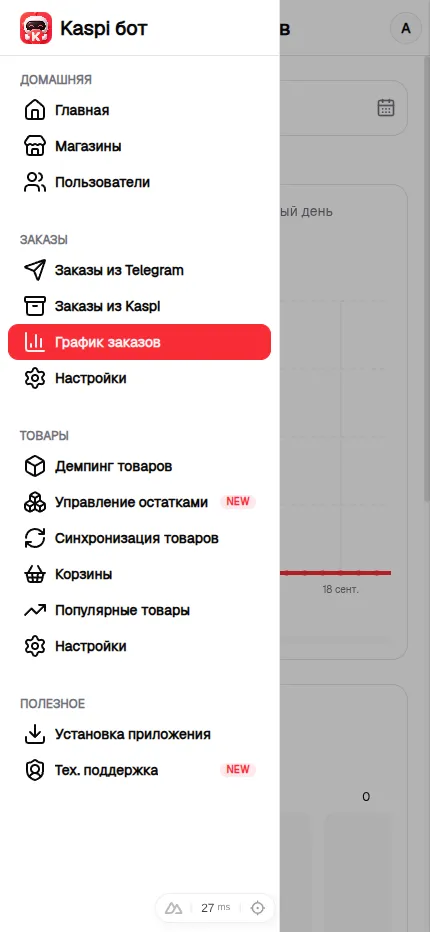
Order trends for any period
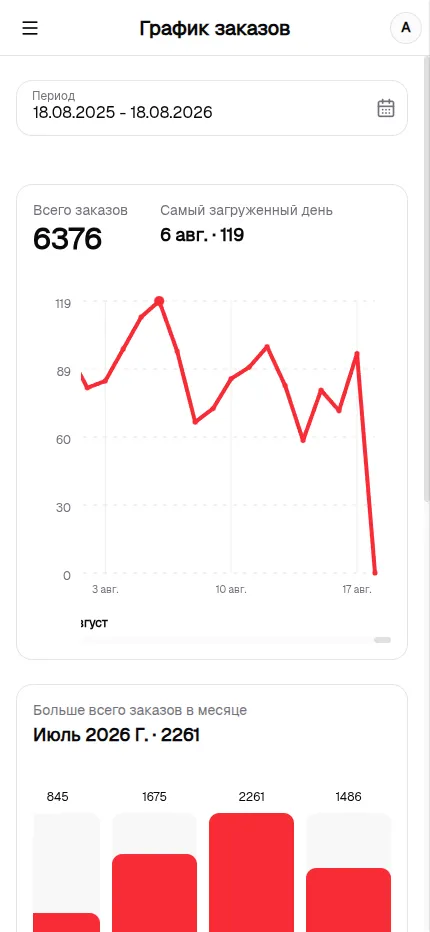
Select a date range and view the number of orders for each day. Kaspi Bot shows the total and the busiest day, making changes in demand visible without manual calculations.
Month-by-month comparison
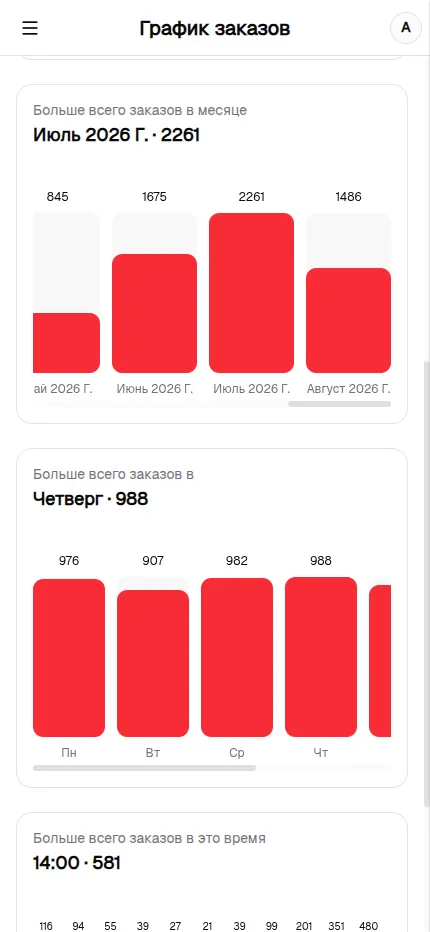
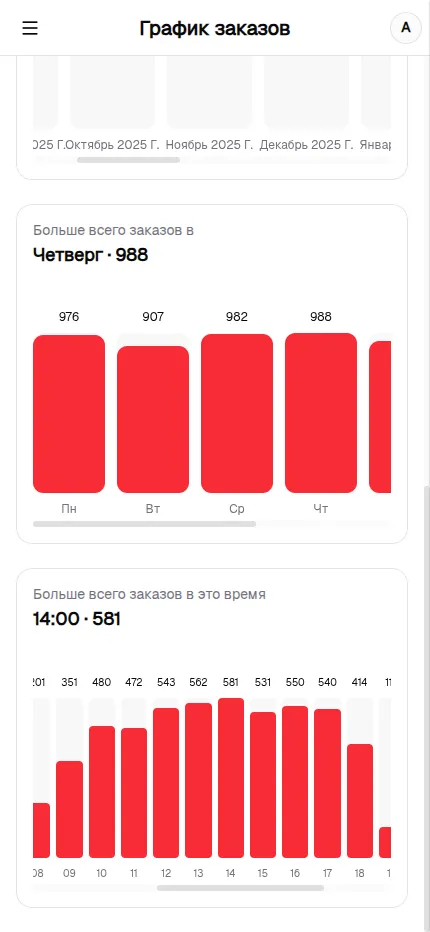
The monthly chart reveals seasonality and identifies the month with the most orders. Use it to plan purchasing, stock levels, and promotional activity.
Demand by weekday
A separate chart groups orders by weekday and highlights when customers are most active. This makes it easier to distribute the team's workload and prepare for peak days.
Orders by time of day
Hourly statistics show how orders are distributed throughout the day and identify the busiest hour. You can see exactly when new orders are most likely to arrive.
Popular products
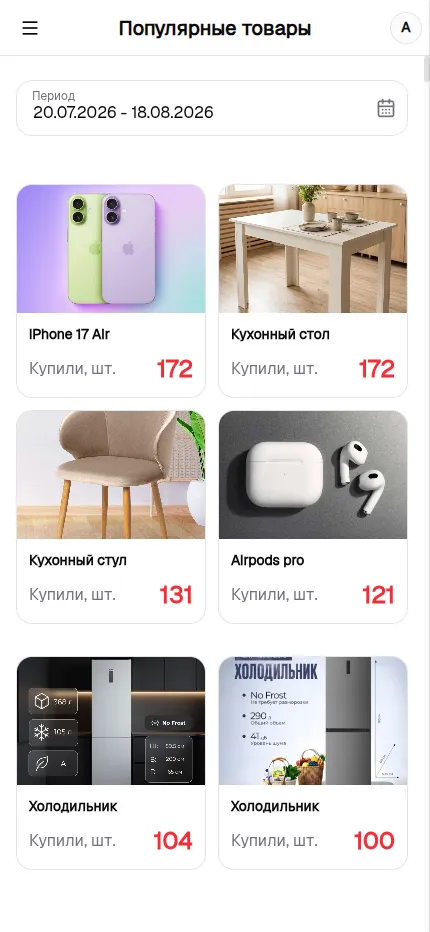
Kaspi Bot counts purchased units from completed orders over the selected period. The list helps identify products with consistent demand and supports better restocking decisions.